
Overview
Cost Volume Profit is an
important managerial and financial analyst tool for understanding the operating
risk faced by a firm. Suppose management
and analysts want to answer the following types of questions:
How much does each $ of sales revenue contribute to the bottom line on average?
How sensitive is the bottom line (i.e., corporate P&L) to a downturn in sales from recession?
How can management and
analysts assess the expected return from a company’s sales and marketing
investing strategy?
You can answer these
types of questions and more, from a Cost Volume Profit analysis.
The starting point is to
first evaluate cost behavior in terms of the following simple equation:
Total Cost
(TC) = Variable Cost per Unit of Activity (VC) * Activity + Fixed Costs (FC) 1)
The above is useful for both assessing profitability as well
as assessing risk. For example, this
linear function underlies standard activity analysis where profit and loss is
projected for different levels of activity. For example, an analyst needs to forecast
future earnings and can approach this problem by applying standard CVP analysis
or as it is also referred to “Activity Analysis.” This is because from an outsider’s
perspective the natural choice of “activity” is Sales Revenue. Furthermore, if sales revenue growth can be
predicted and cost behavior can be estimated, an analyst can forecast
earnings. Given the increased importance
of “Earnings Season” in the capital markets this tool assumes additional
importance.
Important Aside
The above equation
assumes that the scale of operations remain unchanged which is usually not the
case for a growing firm as revealed from their investing activities (measured
in the cash flow statement). When this
is the case then an additional adjustment is required to “FC” in equation 1) to
account for the increased level of investing activities resulting in increased
Fixed Costs (FC) when projecting future earnings.
Implementing Cost Volume Profit Analysis
For CVP analysis we need
to estimate the % of each cost category that is variable. That is, if $100 is COGS what is the %
variable and what is the % fixed?
Equation 1) does not
answer this second question. Assuming
the unit of activity is $ sales revenue then VC is a % of Sales Revenue but not
a % of the cost category. To compute the
% of the cost category we apply the following transformation:
%
Variable Cost for a specific Category = (VC*Sales/Cost Category)*100 2)
Applying CVP Analysis
In this lesson we will
assume that Sales Revenue is the unit of activity.
Step 1: Estimating the Variable Cost per $ of Sales
Revenue
There are three main approaches
to assessing cost behavior. These
approaches are:
Account Analysis and
Professional Judgment
High-Low Cost Method
Regression Analysis
In practice an analyst
will employ all three techniques.
Step 2: Transform the estimate into a relative % for each cost category.
Account Analysis and Professional Judgment
First, Account Analysis
is always the starting place. Here
understanding the business model and the relative makeup f the balance sheet is
important. For example, COGS for a retailer
is going to have a large variable proportion to it even if you know some fixed
costs are allocated to COGS. The simple
reason being the higher the turnover the larger the dominance the variable cost
drivers will be in COGS. As a result,
for a retailer it is not unusual to assume between 90-100% variable. Similarly, for business that does not have a
large amount of fixed assets on their balance sheet.
For example, contrast
the latest Balance Sheets for Microsoft and Intel (using Valuation Tutor’s data
collector and plotting abilities):


It is immediately clear
that Property Plant and Equipment is of far more importance to Intel’s business
model than it is to Microsoft.
As a result, estimating
the % of cost of goods sold that is variable usually require going beyond the
professional judgment approach.
Estimating Cost Behavior Relative to Sales for
COGS
The easiest technique to
apply is the High/Low method. This will
give a reasonable estimate. For the case
of Intel, by examining two recent 10-K’s and using the data collector, we can
collect four or five past observations:

In the above example, we
have collected all cost categories down to Operating Income for Intel from
their 2012 10-K and their 2010 10-K.
Note: for some firms you
may need to work with their 10-Q’s.
By double clicking on
any line item in the LHS of the screen automatically transmits to the RHS so it
is easy to work across statements. When
done click on Copy All (Button RHS of screen), Paste into Excel and Clean Up to
get:

Operating expenses is
the sum of Research and development, Marketing, general and administration,
Restructuring and Amortizations.
Hi Lo Method
This method uses
observations on two dates to estimate fixed costs and the variable cost per
dollar of sales revenue. The Y-Axis
variable is the aggregate cost category and the X-axis variable is the volume
of activity (sales revenue for a financial analyst).
Variable
Cost Per $ Sales Revenue = (Total Costs
High Sales Revenue – Total Costs Low Sales Revenue)/(Sales Revenue High – Sales
Revenue Low)
Working with the above
Intel Data the Hi/Lo method reveals:

That is, the Variable
Cost per $ of Sales for Intel’s Cost of Sales equals 0.1157.
Question: What is the cost behavior equation?
The beauty of the hi/lo
technique is that you can solve for FC from by substituting in one of the two
points:
Total Cost (TC) = Variable Cost per Unit of Activity (VC) * Activity
+ Fixed Costs (FC)
53,999 = 0.1157*20,242 + FC => FC = 13,994.
Regression Analysis:
One advantage of running
a simple regression is that we now use all observations not just the high and
the low. Running regression we get a
little higher estimate for the Variable Cost per Dollar of Sales at: 0.185 and
a lower fixed cost estimate of $9496.
In both cases this is
well below the case for a retailer or a software company.
Working with the
regression analysis then the % variable costs for COGS is 18.5% and 81.5%
fixed.

Results from Cost Behavior Analysis:

Columns 2 and 3 contain
the results from Hi/Lo for all cost categories and columns 4 and 5 the
regression analysis. Columns 2 and 4
contain the estimate of the variable cost per dollar of sales and columns 3 and
5 the implied Fixed Costs from the analysis.
Observation 1: When the implied fixed costs are negative
this is consistent with the model being miss-specified and so it is clear that
this happens less with the regression analysis versus the Hi/Lo the former
which processes more information to arrive at the estimate. In practice an analyst will combine their
professional judgment with statistical techniques such as regression analysis
to arrive at their final estimates for cost behavior.
A second important
point, especially when working across firms, is to impose some standard cost
categories upon the analysis. In
Valuation Tutor these cost categories are:
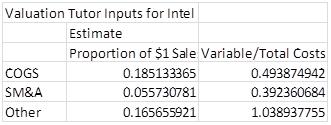
COGS, Sales, Marketing and Administration and Other. So for Intel our estimates for these three
categories are:

Other is based upon on
Research and Development which dominates this category for Intel. Given the projected proportion is greater
than one we will apply this as 100% variable and 0% fixed. This is consistent with the fact that
Research and Development is budgeted as a percent of sales.
The relationship between
the 2nd and 3rd columns above is that column 2 comes
directly from the Total Cost Equation that can be estimated from regression
analysis or applying the hi/low method to estimate the straight line. That is, column 2 is expressed relative to
the level of activity (i.e., % of sales).
Column 3 is the coefficient transformed to re-express the variable cost
component relative to the cost category directly as opposed to being a % of
Sales. The relationship between the two
columns are:
Variable/Total Costs =
Proportion of the costs relative to $1 Revenue * (Sales Revenue/Total Costs for
the Cost Category (e.g., COGS)).
0.4939 =
0.1851*(53,999/20,242)
In other words, the proportion
of variable costs to the total cost category will be higher than variable cost
per $ of sales estimated from a traditional regression analysis.
It is noted that the
inputs into Valuation Tutor are in the form of the third column, the proportion
of variable to the total costs in each category. This is because although a user may estimate
this from a regression it is also common to do this by employing account
identification/professional judgment.
Working with the Above Assessments: Variable versus Full Costing Income
Statements
In the screen shot below
the Valuation Tutor calculator is provided for Intel. Two income statement formats are
provided.
The two formats differ as
follows, in relation to Net Income from Operations (Illustrated for INTC in
millions for year ending Dec 31, 2011):
Absorption Costing:
Sales
(53,999)
Less
COGS (20,242)
Gross
Margin (33,757)
Less
Marketing and Administration (7,670)
Less
Other (8610)
Net
Income from Operations (17,477)
Now given our earlier estimates for
the proportion of variable costs for each expense line item provided earlier:

What are the immediate advantages from recasting the above in this way?
The immediate answers to this are
summarized as follows. A user can
immediately pull off the following set of performance measures:
Contribution
Margin Ratio = Contribution Margin/Sales Revenue
Contribution
Margin Ratio = (Sales Revenue – Total Variable Costs)/Sales Revenue
Break
Even (B/E) Analysis ($Sales Revenue) =
Total Fixed Costs/(Contribution Margin Ratio)
Break
Even (B/E) Margin = B/E $Sales Revenue/$Sales Revenue
For Intel these are:

Conclusions
Cost Volume Profit is an
important managerial and financial analyst tool for understanding the operating
risk faced by a firm. Some of the
important questions answered from this analysis are:
How much does each $ of
sales revenue contribute to the bottom line on average?
How sensitive is the
bottom line (i.e., corporate P&L) to a downturn in sales from recession?
Alternatively,
What is the current
Margin of Safety? Is this improving or
deteriorating?
When we connected the
dots across financial statements in an earlier lesson the potential importance
of investing in sales and marketing became apparent.
How can management and
analysts assess a company’s sales and marketing investing strategy?
Here again CVP analysis
provides powerful insights to be gained into these types of questions. For example, if the company spends $x on a
marketing campaign that is expected to increase sales revenue by y% what type
of return is this likely to generate and does this return cover the initial
investment cost of the marketing campaign?
The answer to this
question requires performing a cost versus benefit
analysis where the expected benefit is measured from the contribution margin
associated with the projected increase in sales.
0 comments:
Post a Comment