“Never
invest in a business that you cannot understand” -Warren
Buffet
Historically, it was the financial professionals who had the
easiest access to corporate data. Today
this has all changed, thanks to the SEC.
The SEC’s interactive disclosure standards have leveled the investment playing
field and brought Buffet’s quote within the reach of every investor. A stated objective of
the SEC is:
“As more companies embrace
interactive data, sophisticated analysis tools now used by financial
professionals could become available to the average investor.” -
What is really implied by this objective?
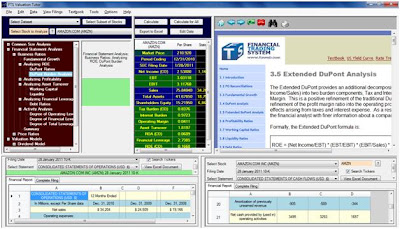
Consider the following Valuation Tutor application screen that
sits on top of the SEC’s interactive data:
There are four major components to this screen. The top Right Hand Side (RHS) provides the
conceptual framework and analytical tools, designed to operate and transform interactive
data into information. The top Left Hand Side (LHS) is an online
text that provides the concepts and operational steps required for working with
the top RHS. The bottom LHS and RHS
provide immediate access to the interactive data itself. Simply, enter the stock’s ticker and an
amazing amount of data is suddenly available.
For example, consider Amazon.com (AMZN). By entering the stock ticker AMZN, Valuation
Tutor immediately pulls in the following list of reports:
Suppose you want the latest 10-K which at the time of this
blog was filed on the 28th January 2011 as illustrated above. By selecting this report the following list
is now available to an investor:
The above is only a partial list as you can see from the
scroll bar there is a lot more that can be scrolled down to.
Suppose you select the Consolidated Statement of Operations
for Amazon. This further provides access
to the following:
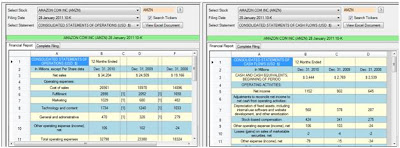
Or similarly, you may be interested in comparing this with
Amazon’s Cash Flow Statement. You can
pull these up side-by-side:
By clicking on View Excel Document in either window provides
immediate access to this data in Excel for further processing.
Finally, to understand what Amazon’s business model and
business strategy actually is you can further give yourself immediate access to
the 10-K report itself. This requires a
couple of steps, click on the menu item
View Filings and select either SEC Filing Viewer on Right or SEC Filing Viewer
Popup as illustrated below:
The popup is useful if you have the luxury of two screens
but even on a single screen it is very powerful. The Viewer appears as follows (I have entered
AMZN as the ticker again):
In the above LHS the two tabs are Financial Report and
Complete Filing. The financial report is
as described before but the Complete Filing now provides immediate access to
the 10-K report by scrolling down as follows:
To read the 10-K, click on the hyperlink under the Document:
Finally, on the RHS of the screen is the tab Data
Collector. This can be used to design
your own Excel Spreadsheet. Instead of
dumping out all fields you can be selective across statements. Click on Financial Report in the LHS of the
screen and bring up Amazon’s Consolidated Cash Flow Statement then click on
Data Collector on the RHS and the screen appears as follows:
You can now decide what fields you want dumped into Excel by
simply double clicking on a row in the LHS.
You can work across statements as well so that you are mixing and
matching from the Balance Sheet, Income Statement and Cash Flow or other
statements. For an example, suppose I
double click on Net Income, Net Cash used in Operating Activities, Investing
Activities and Financing Activities then the following appears in the RHS:
Finally, click on Copy All and Paste into Excel to provide
the following spreadsheet ready for use:
The original architects of the 1933/1934 Securities Acts
could never have dreamed about the power they were unleashing with these
acts. So this is our interpretation of
what the SEC meant in their following quote:
“As more companies embrace
interactive data, sophisticated analysis tools now used by financial
professionals could become available to the average investor.”
In subsequent blogs we will discuss how to transform this
data into information.


0 comments:
Post a Comment